Nibedita Sahu

|

About Me

Hi, I'm Nate (short for Nibedita), a Data Science & Analytics Enthusiast with a strong foundation in Mathematics. I specialize in using Python, SQL, Power BI, and Business Mathematics & Statistics to analyze, visualize, and interpret data. With a passion for Problem-Solving and Data Storytelling, I focus on making complex data easy to understand through clear insights and visualizations. I'm constantly learning and refining my existing skills, working on projects that challenge me to grow and explore new opportunities.


View Resume

Skills

Tools & Technologies

Programming Languages: Python SQL

Libraries: NumPy Pandas Matplotlib Seaborn Scikit-learn StatsModels SciPy

Version Control: Git GitHub

IDEs & Databases: VS Code Jupyter Notebook Google Colab MySQL PostgreSQL

Markup & Documentation: Markdown HTML CSS LaTeX

Business Intelligence & Data Management: Power BI Tableau Excel

Presentation & Designing: PowerPoint Canva

Techniques & Concepts
Data Wrangling Exploratory Data Analysis Feature Engineering Probability & Statistics Mathematical Modeling Supervised Learning Unsupervised Learning Model Evaluation Cross-Validation Bias-Variance Tradeoff Regularization Time Series Forecasting Predictive Modeling Experiment Design Data Visualization Data Storytelling Analytical Thinking Problem Solving Decision Intelligence

Background

🎓 Bachelor of Science in Mathematics

With a strong analytical mindset shaped through my academic journey, I've developed a natural inclination toward solving data-driven problems. My degree has helped me understand the logic, structure, and patterns that form the backbone of Data Science & Analytics.


Kalahandi University, Bhawanipatna, Odisha
2020-2023

Projects

Project 5 Image

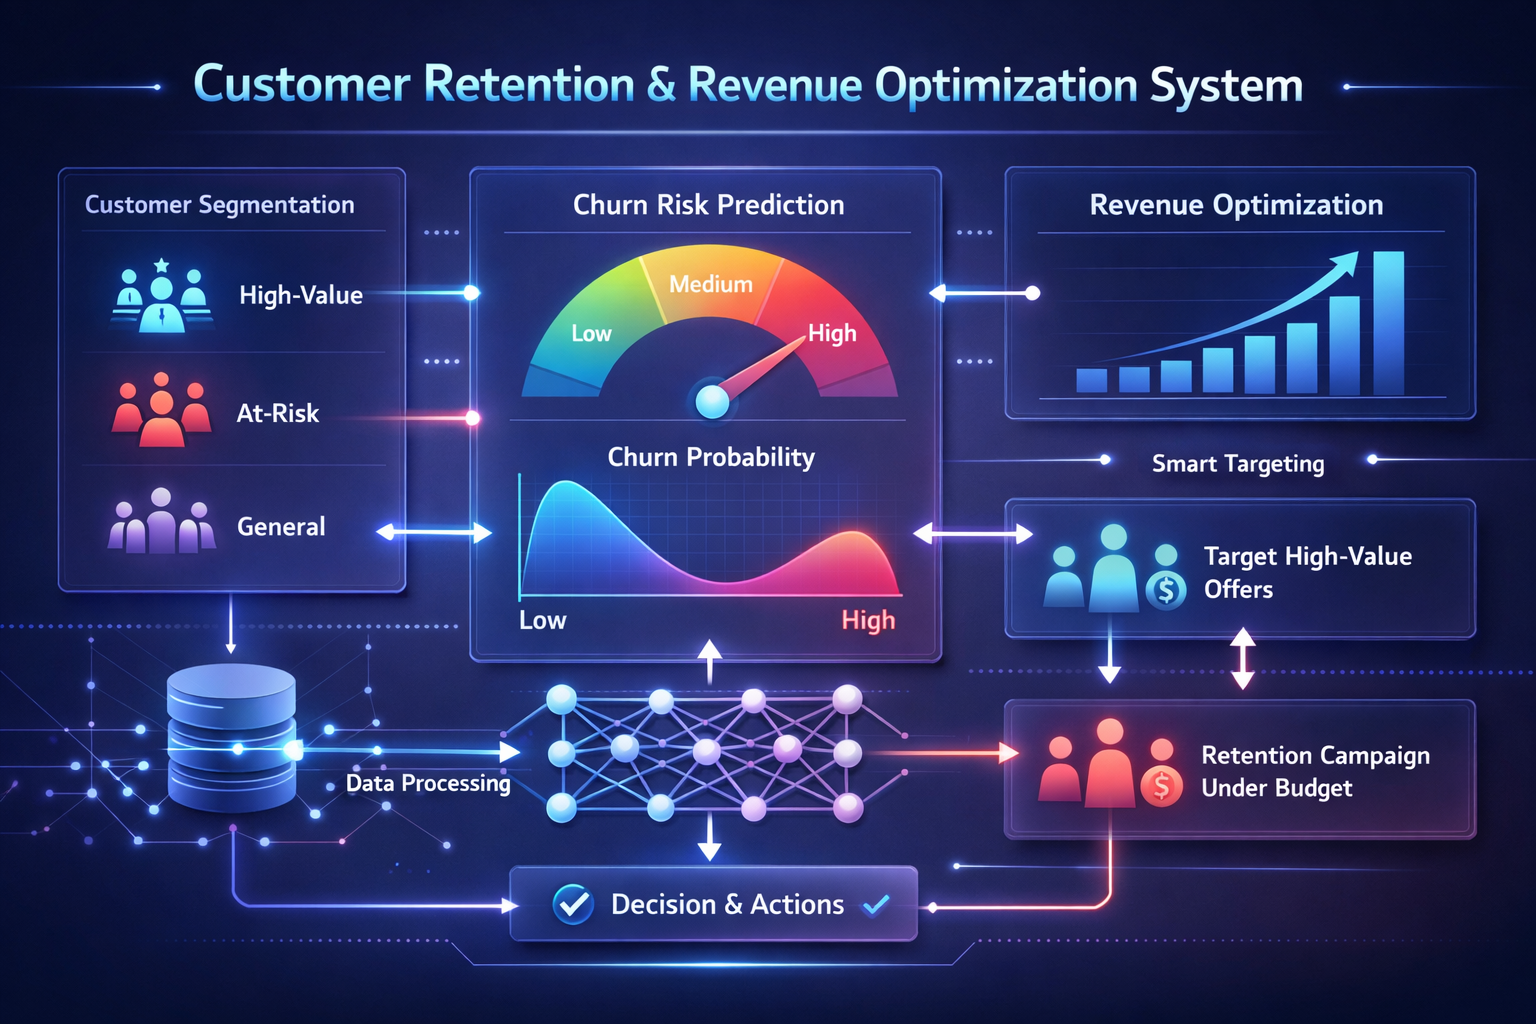
Electric Vehicle Population Analysis

A complete end-to-end data analysis project exploring Electric Vehicle adoption. Used SQL, Python, and Power BI to clean, analyze, and visualize trends in EV types, range, and policy eligibility. Delivered actionable insights on top-performing models, regional adoption, and CAFV alignment through a multi-page report and presentation.

GitHub

IBM HR Employee Attrition Analysis

This project analyzes employee turnover using Python and Power BI to find out why employees leave. It explores factors like job roles, departments, and employee demographics to identify patterns and trends. The insights help HR teams make better decisions to improve employee retention. Visualizations and data-driven analysis make it easy to understand key factors affecting attrition.

GitHub View Notebook
Project 4 Image
Project 3 Image

Customer Sales Performance Analysis

An end-to-end data analytics project analyzing customer sales using Python, SQL, and Power BI. Data was explored and cleaned in Jupyter Notebook, queried with MySQL, and visualized through interactive Power BI dashboards to enable clear identification of sales trends, customer behaviors, and key business drivers.

GitHub View Presentation

Credit Card Financial Analysis

A Power BI dashboard providing real-time insights into credit card transactions, customer behavior, and key financial metrics. The project leverages data visualization to identify spending patterns, detect anomalies, and support strategic financial decisions. It combines analytical rigor with intuitive design for effective data storytelling.

GitHub View Presentation
Project 2 Image
Project 1 Image

Super Store Sales Analysis & Forecasting

An interactive Power BI dashboard designed to analyze superstore sales data, track key performance indicators, and uncover actionable business insights. Leveraging time series analysis, the project provides accurate 15-day sales forecasts to support proactive decision-making. Explore sales trends, product performance, and regional patterns through intuitive visualizations and advanced analytics.

GitHub View Presentation
View More Projects

Explore Case Studies

Here you'll find detailed breakdowns of the projects and problems I've worked on. Some focus on individual challenges, while others explore projects I've built, walking through the decisions, steps, and reasoning behind each approach. Each case study gives a clear picture of how I approached a problem, what I learned, and the insights that came out of it. Whether you're exploring solutions, curious about how things work, or just enjoy seeing problems being solved, there's something here for you.
Project-Based Problem-Based

Lab ⇝ Experiment • Build • Explore

Lab Project 3

End-to-End Time Series Analysis & Forecasting with Nutrition Data

A fully documented Time Series Analysis project built on a realistic multi-year nutrition dataset. The project progresses from dataset design and proper time handling to trend, seasonality, and variability analysis, followed by simple, interpretable forecasting. It focuses on understanding real-world time-based behavior, avoiding common pitfalls, and communicating insights clearly through visual storytelling.

GitHub

Regression Framework for Systolic Blood Pressure Prediction

A fully documented Regression workflow to predict Systolic Blood Pressure using Age, BMI, Activity, and Salt Intake. The project progresses from simple to multiple regression, manual β-calculation, and a final scikit-learn model. It focuses on clarity, interpretability, and comparing different modeling approaches, not just running code. Perfect as a reusable framework for Linear Regression.

GitHub Read Article
Lab Project 2
Try This Web App - Body Fat Calculator

This web app calculates Body Fat %, Fat Mass (kg), and Lean Mass (kg) interactively. Built with Pandas & Streamlit!

GitHub Open Live App Read Article


View More Experiments

Contact Me